Introduction
The Spotify stats pie chart has become an increasingly popular feature among users, offering a unique way to visualize and comprehend one’s music taste. By transforming listening data into engaging and colorful visuals, Spotify statistics provide a personalized and interactive dimension to the overall listening experience.
Users can connect with Spotify to unlock their unique musical profile and explore personalized Spotify stats, including top artists, songs, and genres based on their listening history. The platform emphasizes safe, secure, and easy-to-use navigation for exploring personalized music analysis.
The value of discovering and understanding one’s music taste through personalized Spotify statistics cannot be understated. It offers insights into individual preferences, leading to a deeper connection with music. This feature adds a new layer of enjoyment to the streaming experience, allowing users to engage with their music in a more meaningful way.
Understanding Different Types of Spotify Stats
The various types of Spotify stats available to users offer a comprehensive understanding of one’s musical preferences. These include:
Spotify Charts
These charts showcase the trending songs and artists globally, regionally, or even based on specific genres.
Top Artists
Users can explore their most frequently listened to artists, helping them understand their music taste and preferences.
Top Songs
This metric highlights the songs that have resonated the most with the user, providing insights into their favorite tracks.
Top Genres
By analyzing the genres that dominate a user’s listening habits, Spotify provides valuable insights into individual music preferences.
Personalized Music Analysis
Spotify offers individual listening insights that delve into detailed statistics about a user’s music consumption patterns, such as total listening time, favorite genres, and much more.
These different metrics contribute to a holistic understanding of one’s musical inclinations. By combining data on top artists, songs, and genres, users gain a deeper insight into their music taste and can discover new trends and emerging favorites.
Part 1: Exploring Your Personalized Spotify Stats
Step 1: Method 1
To access your personalized Spotify stats, there are two methods you can use. Let’s start with Method 1:
- Open the Spotify app on your device and go to the home screen.
- Scroll down until you find the “Made for You” section.
- In this section, you will see a variety of playlists and recommendations tailored to your music taste.
- Look for the playlist called “Your Top Songs [year]”, where [year] represents the current year. For example, if you’re accessing your stats in 2022, it will be “Your Top Songs 2022”.
- Tap on this playlist to open it.
By following these steps, you will be able to see a collection of your top songs from the current year based on your listening habits. This playlist is automatically generated by Spotify using algorithms that analyze your listening history and preferences.
Note: This method specifically provides insights into your top songs for the current year, giving you a snapshot of your recent music taste. If you’re looking for more comprehensive statistics or want to explore different time periods, we’ll discuss another method in the next section.
Step 2: Method 2
In addition to Method 1, there is another way to explore your Spotify stats:
- Open a web browser on your computer or mobile device.
- Go to the Spotify website and log in to your account.
- Once logged in, navigate to the “Wrapped” page or search for “Spotify Wrapped” in the search bar.
- Click on the official Spotify Wrapped website or any reliable sources that provide access to this feature.
- Follow the instructions provided on the website to generate your personalized Spotify Wrapped report.
Spotify Wrapped is an annual feature that allows users to discover their top songs, artists, and genres from the past year. It provides a comprehensive overview of your listening habits and even generates a shareable infographic that highlights your music preferences. This method is particularly useful if you want to delve deeper into your long-term music taste or compare your stats with previous years.
By utilizing both Method 1 and Method 2, you can gain a better understanding of your Spotify stats from different angles and timeframes. Whether you prefer a quick snapshot of your recent music taste or a detailed analysis of your overall listening history, exploring your personalized Spotify stats can be an exciting and insightful experience.
Step 2: Method 2
To access your personalized Spotify stats, there is another method you can use besides Method 1. This alternative method allows you to explore your Spotify stats using a different approach. Here’s how you can do it:
- Open the Spotify app or visit the Spotify website on your computer.
- Go to the “Home” tab or click on your profile picture at the top right corner of the screen to navigate to your account settings.
- Scroll down and look for the “Your Library” section.
- Click on “Made For You” or “Your Library” to access your personalized content.
- Under the “Made For You” or “Your Library” section, you will find various categories such as “Recently Played,” “Liked Songs,” and more.
- Explore these categories to find insights about your listening habits, including top artists, songs, genres, and playlists tailored specifically for you.
By following this method, you can easily access your own personalized Spotify stats feature within the app or website interface. This allows you to delve deeper into your music taste and discover interesting facts about your listening preferences.
Both Method 1 and Method 2 provide different ways to access your Spotify stats, so feel free to try them both and compare the insights they offer. With these methods at your disposal, you can gain a comprehensive understanding of your music taste and further enhance your music discovery journey.
Part 2: Making Sense of Your Spotify Pie Chart
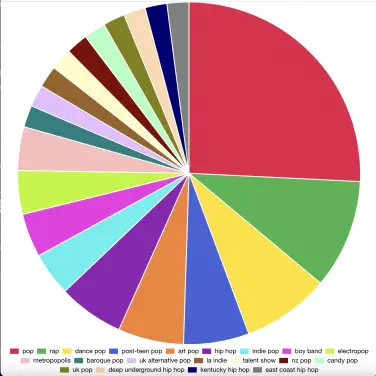
The Spotify Pie Chart is a captivating visual representation of your music taste, offering a unique way to explore and understand your listening habits. Here’s how you can interpret the slices of your Spotify Pie Chart and uncover valuable insights about your musical preferences:
Interpreting the Slices
When you look at your Spotify Pie Chart, each slice represents a specific aspect of your music listening history. Here’s how you can interpret these slices:
- Top Artists: This slice showcases the artists you’ve listened to the most. It provides a clear picture of your favorite musicians and the impact they have on your listening experience.
- Favorite Genres: The genre slices reveal the diversity of music in your library. You might discover that you have a penchant for a particular genre or that your tastes are more eclectic than you realized.
- Most Played Songs: This slice highlights the individual songs that have resonated with you the most. It’s an opportunity to reminisce on the tracks that have left a lasting impression.
- Listening Time: The distribution of listening time across different categories reflects how much time you’ve dedicated to exploring new music, indulging in familiar favorites, or diving into specific genres.
By examining these slices collectively, you gain a comprehensive understanding of your music preferences, allowing for deeper self-discovery and appreciation of your unique musical palette.
The Spotify Pie Chart empowers you to visualize and comprehend your music consumption patterns in an engaging and enlightening manner, ultimately enhancing your overall listening experience.
Sharing and Comparing Pie Charts
The Spotify Pie Chart feature provides an engaging way to visualize your music taste. Each section represents a specific genre distribution or artist preference, allowing you to gain valuable insights into your listening habits.
Discuss the option to share Spotify Pie Charts on social media and engage in friendly competitions or comparisons with friends.
Users can easily share their Spotify Pie Charts on various social media platforms, sparking conversations and friendly debates about music preferences. This sharing feature adds a fun and interactive dimension to the music discovery experience, allowing users to connect with friends over common or contrasting musical interests.
2. Compare Pie Charts with Friends
Users can also compare their pie charts with those of their friends, creating an opportunity for friendly competition or curiosity about each other’s music tastes.
Comparing pie charts with friends can lead to discovering new artists or genres, expanding your musical horizons through shared recommendations and discussions. It’s a great way to bond over music and explore diverse tastes within your social circle.
By sharing and comparing pie charts, users can foster a sense of community around music exploration and gain fresh perspectives on their own listening habits. This collaborative approach enhances the overall Spotify experience, turning individual statistics into shared moments of discovery and connection.
Other Ways to Utilize Your Spotify Stats
The Spotify Pie Chart feature offers more than just a visual representation of your music taste. It also provides additional tools such as Bubble Charts, which can offer deeper insights into your listening behavior on Spotify.
Unlocking Insights with Bubble Charts
Bubble Charts are a unique feature that allows users to explore their music library in a visually engaging way. By analyzing the relationships between different artists or genres, Bubble Charts can reveal patterns and connections that may not be immediately apparent from the standard Spotify statistics.
Here’s how you can make use of Bubble Charts to gain a deeper understanding of your music preferences:
Discovering Unique Patterns
Bubble Charts can help you identify patterns in your listening habits that go beyond simple top artists or genres. By visualizing the relationships between different musical elements, you may uncover surprising connections or trends in your music library.
Exploring Genre Dynamics
With Bubble Charts, you can delve into the dynamics between various music genres in your collection. This can be particularly insightful for users who enjoy a wide range of musical styles and want to understand how they interact within their listening habits.
Uncovering Hidden Gems
Bubble Charts can highlight lesser-known artists or genres that play a significant role in your music consumption. By identifying these “hidden gems,” you may open yourself up to new avenues of musical exploration and discovery.
By leveraging the power of Bubble Charts, Spotify users can gain a more nuanced understanding of their music preferences and behaviors. This additional layer of insight complements the Spotify Pie Chart, offering a comprehensive view of one’s personalized music profile.
Privacy Considerations for Sharing Spotify Stats
When it comes to sharing personal Spotify stats, privacy is a key concern for many users. Here are some important considerations to keep in mind:
1. Data Security
Understand how Spotify protects and uses your data before accessing and sharing your personal stats. Ensure that the platform adheres to strict privacy policies and data encryption standards to safeguard your information.
2. Granular Control
Explore the options available for controlling the visibility of your Spotify stats. Look for settings that allow you to choose who can view your listening history and customized charts, providing you with the flexibility to maintain privacy.
3. Safe Sharing
When sharing Spotify stats on social media or other platforms, be mindful of the information you’re disclosing. Avoid revealing sensitive details or personally identifiable information that could compromise your privacy.
4. Consent and Permissions
Before granting access to third-party apps or services that utilize your Spotify data, review the permissions requested carefully. Only authorize trustworthy applications with clear privacy practices.
By prioritizing privacy and safe sharing practices, you can confidently engage with your personalized Spotify statistics while protecting your sensitive information from unauthorized access or misuse.
The Future of Spotify Statistics: AI-Generated Presentations
- AI-generated presentations: The future of Spotify statistics involves leveraging AI-generated presentations to create dynamic and data-driven visual representations of personalized music insights.
- Decktopus: AI tools like Decktopus can transform Spotify stats into engaging and interactive presentations, allowing users to share their music preferences in a visually compelling format.
- Future trends: As AI technology continues to advance, we can anticipate more sophisticated and customizable ways of presenting Spotify statistics, enhancing the overall experience of music discovery and sharing.
By harnessing the power of AI-generated presentations, Spotify users can elevate their music exploration journey by visually showcasing their unique listening preferences. With tools like Decktopus, the future holds exciting potential for transforming raw data into captivating stories that reflect individual musical identities.
Conclusion
Encourage readers to explore their own Spotify stats through the pie chart feature and leverage the insights gained to further enhance their music discovery journey.
The Spotify stats pie chart offers a captivating way to visualize your music preferences and habits, adding a unique dimension to your listening experience. By diving into your personalized Spotify statistics, you can unlock valuable insights about your favorite genres, top artists, and most-played tracks. With the ability to interpret the slices of your pie chart, you can gain a deeper understanding of your music taste and make more informed choices when exploring new songs and artists.
Sharing your Spotify pie chart with friends can spark engaging conversations and friendly competitions centered around music exploration. Additionally, considering other visual representations like Bubble Charts can provide even more in-depth analysis of your listening behavior on Spotify. This multifaceted approach allows you to fully grasp the nuances of your music preferences and discover new trends within your listening history.
As you continue to delve into your Spotify stats, remember to consider privacy implications when sharing this information online. With the future potential of AI-generated presentations based on Spotify statistics, there are exciting prospects for using data-driven insights in innovative ways. Embrace the journey of uncovering your musical profile through Spotify stats and embrace the wealth of knowledge it brings to your music discovery endeavors.
